

We've Moved
polychromecapital.substack.com
We have moved our blog onto our website. Please visit us at https://www.polychrome.com/blog for the latest posts.
Thanks,
The Polychrome Team
We have moved our blog onto our website. Please visit us at https://www.polychrome.com/blog for the latest posts.
Thanks,
The Polychrome Team

If you are reading this I’m pretty sure you’ve been feeling or hearing it too over the last few years. Experienced operators and founders share the following with me regularly:
“Adwords feels unsustainable and expensive for single product companies to really scale growth with. I just don’t feel like I have another choice.”
“Outbound response rates on LinkedIn messaging or email are generating less results.”
“Keyword content is very competitive and doesn’t seem to be effective.”
If you think about it, all three of these channels tend to be treated as transactional or “pay-to-play”. Because of this, I think of them all as “rented channels”. Two of which the landlord is Google.
This article aims to question if these make sense for early-stage SaaS companies anymore, and addresses the core issues with them. I’ll also provide some real-world alternatives that I’ve either seen or helped build, what worked and what didn’t, and some questions to help guide your thinking on if it’s time to adjust your channel strategies.
A few points can pretty easily explain what’s happening with the effectiveness and efficiency of these channels (and any channel that you don’t own).
Competition is growing: It’s pretty obvious and it’s the sheer growth in B2B SaaS companies over the last 10 years. Depending on who you ask, the number of active SaaS companies is around 30,000 today. If that isn’t crazy enough, we all know that we don’t just compete with direct saas competition for customers. There are full-service agencies, on-prem providers, in-house and even free/open source to consider.
Rented Channels are easier to get started with: The benefit of “pay-to-play” channels is that you can get them set-up really quickly. There are literally thousands of Adwords, Content/SEO and even outsourced SDR agencies around the world to make it “simple to get started right away”! All of them want you to think of the channels on performance basis (CPA, CPL, etc.) that you can turn on right now and with little effort.
You are often competing against companies with bigger Customer LTVs: This point is the most nuanced, but critical to remember. Most companies that are struggling with channel identification tend to be 1) single-product saas businesses and 2) earlier in their life (startups). And in almost all cases, they are using price and a focused feature set to compete with the existing market. If you are going up against a competitor that has a fundamentally higher average Customer LTV, it is almost certain that they will always be able to outbid you. The reason for this is because they can make back the money over the life of the customer.
To drive this home, let’s consider that we want to start a new CRM. How are we going to sustainably and profitably acquire customers considering these factors?
Let’s think through the three points above:
Competition: Obviously CRM is a competitive space with both vertical specific and horizontal providers.
Easy/Rented Channels: The rented channels have been executed on and optimized by the likes of Salesforce, Pipedrive, etc. who have deep pockets. Remember, these tend to function like auctions and the seats are full of bidders. Probably not the best place to start.
LTV of Competition: The lifetime value of the competitive companies (Salesforce, Pipedrive, etc.) have a proven LTV that is way higher than we do so all competitive channels will be expensive to us. Even if you think that you’re LTV is theoretically better, that’s a dangerous bet!
This really means we have to find a new way to get to our customers. So how does our new CRM company compete??
For this, I think the best framework available is one that Brian Balfour created called The Four Fits or Market-Product-Model-Channel-Fit. If you haven’t heard of it, I’ll walk you through a quick example here.
Most founders know these things intuitively, but never actually write them out and think of them as ever-changing building blocks. To start, break down your GTM Strategy into the following framework to see where you stand today:
Market:
Who am I building my product to serve?
Example Definition (the more detailed understanding of your market, the better):
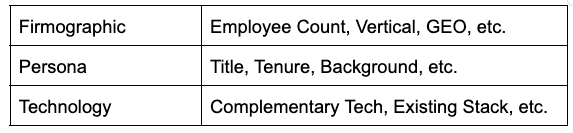
Product:
What is the product that I’m offering and how does it differ from the competition?
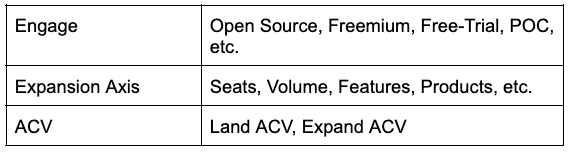
Model:
How do customers engage with your company to purchase the product? Does this make sense considering my target market and how they want to purchase products?
Channel:
What marketing channels am I investing into that fit this product, model and is relevant to my target audience?
Now that you have these four critical pieces defined, what you want to do next is start to look at the interplay of each of the four areas and how they fit with each other.
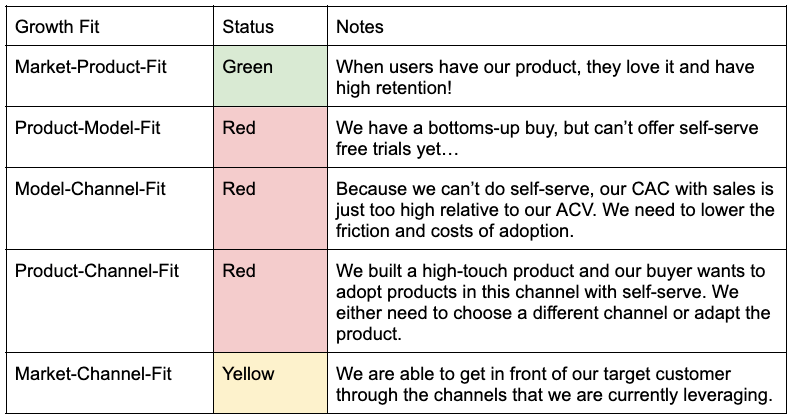
Note: These are just made up responses, but it does highlight the level of depth in which you can inspect your entire GTM motion and how your product “shows-up” in distribution.
The best founders and operators I know don’t want to compete with existing teams for the attention of their target audience…they want to own a direct relationship that goes deeper and has efficiencies built in over time. So, what can we learn from them to apply to our businesses?
I put together a few examples of great acquisition channels that aren't rented. The goal is to help you think outside of rented/obvious channels:

One thing you'll notice right away is that the initial lift for each of these is much higher than that of the “rented channels” (Adwords, Outbound Sales, etc.) we spoke about earlier in the post. With that being said, the "Nth" activity is usually much lower and costs way less. This is what we are looking for. Barrier to entry is real, but you get to live in the Low-CAC Garden of Eden once you build it and it works.
If that’s not enough, here are some that I’ve helped build out over the years:
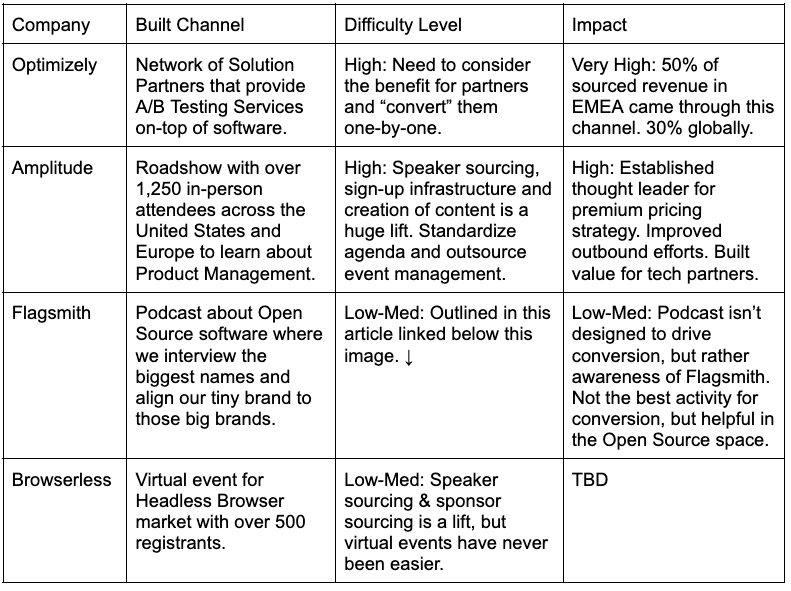
Here is the deep dive an exactly what it took to launch the podcast for Flagsmith.
A final source that can be helpful is writing these out for both the direct competitors as well as the service provider competitors in your space. What learnings do you have after analyzing their approach to acquisition? Does it align with their market, product and model? What can you execute on uniquely in your broader space that they cannot?
As you go and look for these alternative channels for your business, I’d strongly recommend that you make sure they line-up to the questions for quality that we outlined in this post. When brainstorming, remember to not be afraid of things that have a higher barrier to entry as long as the incremental investment is low. Over time, the lower the calories spent and higher repeatability of the effort, the better! That’s where you see the low CAC impact over time.
To help with people in this stage, these questions can help you with critical thinking:
Adjust/Optimize or Cut Existing Channel:
Why isn’t {insert channel here} working like it used to for my company?
Has something changed in the habits of my competition or target customer that would impact this?
Have I allowed a very specific approach (example: outbound to high-value accounts) to broaden (example: outbound to any account) which changed the ROI?
If yes, re-consider your approach.
If no, look to optimize and adjust the channel. If you believe in this channel and feel there is more, it might be time to up-level with experience.
If you aren’t sure, talk to existing or potential customers about the channel and whether they still value it.
Adding/Launching a new channel:
Should I start doing {insert channel here} today?
Is this how my target customer purchases?
Is this a relevant channel to them?
Do I have a specific definition of how we should execute this channel specific to our product, model and market?
If yes, start now!
If not, don’t do it.
If you aren’t sure, talk to existing or potential customers about their habits.
Note: We get this question a lot with content. The answer here is that content comes in many forms (podcast, blogs, 3rd party influencers, talks, playbooks, etc.) and I haven’t met a SaaS company that doesn’t do something in this space. What is common is that they all call it something different. The most effective teams have their audience in mind when they create their definition of content and they’ve considered if it’s relevant and if it’s distributed through the channels where their audience already exists.
Hopefully these are some helpful tools for you to drive sustainable and efficient growth. Remember…don’t just do what your competition is doing. Do the thing that your target audience would actually get value out of.
Thanks,
Matt

I recently read a quote from Xactly (sales compensation software provider - I have no affiliation with them) that states SaaS sales representatives achieve only 58% of their quota. Man, that's brutal…I'd hate to be on that sales team.
Further, if you consider the most common sales compensation structure within SaaS; it is a 50/50 or 60/40 base + bonus split. I'm guessing there are a ton of sellers out there that are not making what they thought they'd be earning over the last 12 months.
On its face, this probably seems like relatively little new information, but if you think about efficient growth and the pure cost of running a sales team; it represents a massive efficiency lever to unlock for operators. Ok…let's dive in.
When I think about sales performance and overall sales efficiency, the number one metric that comes to mind is the ratio between Bookings & Sales Capacity. This post aims to help you:
Understand the components of this key ratio
Help you apply it to your company
How to use it as a guide for additional sales investment
How this can be a canary in the coal mine for sales team culture and health
Bookings : Sales Capacity Ratio Explained:
New Bookings
For the purpose of this article, this will be all "closed won" bookings for the time period you want to measure.
Sales Capacity
The total quota handed out to your sales team.
Example:
4 AEs Total
3 Fully Ramped = Quota * 100%
1 Actively Ramping = Quota * Ramp Discount Rate
The sum of these numbers would be the total “sales capacity”.
To drive this home, here is an example of this concept in a graph form:
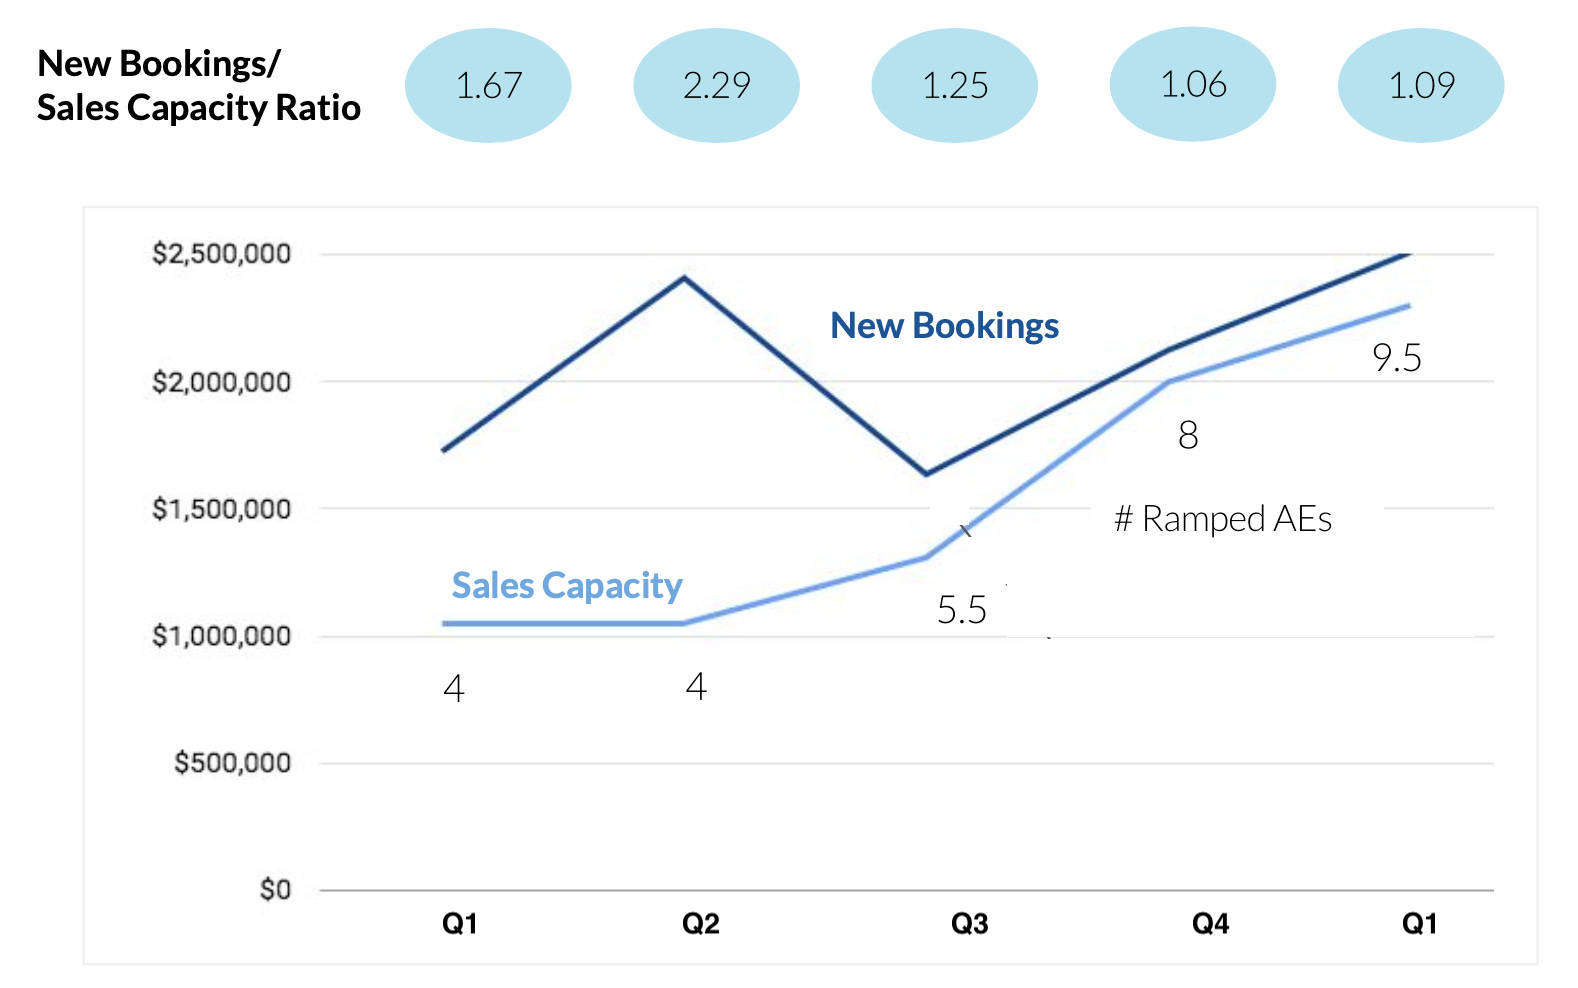
You can see on the x-axis the different quarters and on the y-axis is the dollar amount of bookings. You'll notice in Q3 that there were 5.5 "Ramped Account Executives" which means that there was some level of discounting for people that were ramping.
Key things to notice about this graph:
During the first two quarters, AEs were probably making a lot of money! When you have an even distribution of over-performance, it is a great time to add more sellers!
As more AEs were added to the team, the gap between new bookings and sales capacity closed, but never inverted. During this period some AEs started to dip below their individual quota which can be dangerous if left unmitigated.
Although it our key metric stays above 1.0 in this graph, you will almost certainly have phases where this metric drops below 1.0. Over the long run, most mature organizations settle around a 0.8 ratio, but I'm advocating for a higher standard in times where efficiency is key. Resisting this reduction in the metric as long as possible will help efficiency, but may be an opportunity cost over the long.
Ok, now that you have a better feel for this metric and how it moves over time, it's important to talk about why this ratio is so critical for early stage GTM Teams. To do that, I’ve broken it down into four main topics and I’ll discuss how this single metric can tell you a lot about each of them:
Effective Growth: Baseline for different investment levels to drive growth
Team Building: Culture of winning and momentum
Performance: Establishing what great looks like at your company
Investing: When and how to invest into sales
Like many, I have heard tons of stories about venture backed startups that did massive funding rounds over the last few years. Since then, much has changed in terms of capital availability and we see investors moving back towards true milestone/benchmark based investing. I love seeing this reversion to performance. It aligns investors, operators and individual contributors within companies much more closely.
Think about your goals for the upcoming quarter and how much quota has been handed out to your sales team. If you aren’t confident in hitting them, then ask yourself the following questions:
Is sales capacity really the problem or is it demand generation? Could fewer reps accomplish the same outcome?
Many boards and leadership teams want to have an over-assignment of sales capacity be booking goals to make sure growth goals are met at the company level, but worry less about individual AE-level. Is the reason for increasing sales capacity making the CEO and the board sleep better at night or the sales team?
What do I need to do to help the existing sales team accomplish more than 100% of their quota on average? Do they have a chance in the current set-up or am I just telling myself that?
If you are in the camp where you expect to accomplish anything less than 100% of the quota you have assigned and you are an early stage company, I would urge you to think hard about this approach in these times. Somewhere in that math you are wildly over-spending and the reps are going to leave if they don’t believe they can make their numbers. This results in a terrible team culture and very inefficient growth.
Recruiting great sales and marketing people has never been easy. If you want to build great teams in any market, one of the best ways to recruit is doing so when you are “running down hill” vs “struggling to find growth”.
Here are things people say when their startups aren’t cranking:
“We have so much funding!”
“Reps will definitely hit their quotas!”
“Our OTE (On Target Earnings) is amazing!”
Here are things people say when their startups are cranking:
“We are consistently exceeding our quarterly goals at the team and individual level.”
“We have overperformance from AEs and we need to hire someone to spread out the demand.”
“We have paid out X% over OTE to our reps over the last 2 quarters.”
What’s interesting is that a smart seller would choose a lower OTE (on-target earning comp plan) for the second company, because their belief in achieving their quota is much higher. We did this effectively at Amplitude where we set our OTE below market and our bonus structure well beyond market. This aligned reps with the risk of the business, but was a plan we were confident in offering high performers against seemingly lower comp plans.
By having a team that is overperforming, you are able to attract better performers. Strength leads to more strength. It is an extremely powerful compounding effect over time because your sales organization is full of winners and high-fives.
Most commonly, teams will need to cut their sales team down or at least freeze additional AE hiring to allow performance to catch-up with the sales capacity. If growth isn’t world class for your stage of company and your bookings : sales capacity is well below 0.8, it’s time to slow down and make sure you understand this metric intimately. You should also be prepared to make some changes. This is an extremely difficult thing for CEOs to do, but it is 100% the first step towards turning sales into a much more efficient and eventually profitable lever for growth.
Now that you have focused on trimming down your sales team to drive amazing performance, it is important to know when and how to invest.
As I touched on above in the graph, one great indicator is when you see reps overperforming. The lowest possible risk approach goes like this:
Example:
You have a team of 4 Account Executives and your bookings : sales capacity ratio is steady at 1.25. This means that you can definitely (without generating any additional demand) hire 1 more AE to bring your rate back down to 1.0. Here is the quick math:
Bookings : Sales Capacity Ratio = 1.25
Number of Ramped AEs = 4
4 * 1.25 = 5
In this case, it is clear that the team can support a 5th Account Executive.
The problem with this approach is that it can be very conservative.
Another way to consider investing into your sales team is by looking at demand generation. If you see that your existing team is over a 1.0 Bookings : Sales Capacity Ratio and you have too many leads for them to effectively manage, then it might be a good time to start recruiting more sellers.
In any case, take it slow and make sure you get your ramping of new sellers in place. Adding 1 strong-performer at a 1.0 Bookings : Sales Capacity ratio is much more cost effective and usually just about as effective to growth compared to adding 2 at the stated average of 58% quota attainment. This is highlighted here:
Assumptions
Compensation: 50% Base / 50% Bonus
OTE: $200,000/year
Quota: $1,000,000/yearCost Breakdown of Different Approaches:
”Aggressive Investment Approach”
Total Bookings: 58% * $1,000,000 * 2 = $1,160,000 in Sales Bookings
Cost of 2 AEs @ 58%: $158,000 * 2 = $316,000 in Salary + BonusCost of Sales compared to bookings: 27%
-VS-
“Efficient investment Approach”
Total Bookings: 100% * $1,000,000 * 1 = $1,000,000 in Sales Bookings
Cost of 1 AE @ 100%: $200,000 * 1 = $200,000 in Salary + BonusCost of Sales compared to bookings: 20%
In the example above, it is true that we missed out on $160,000 in Sales Bookings, but the efficiency gain, impact to culture and likelihood of retaining sellers is huge! Further, our cost of sale is 20% with the single strong performer vs. 27% with the two average performers. Imagine the impact to culture and costs at 10 or 20 sellers.
In 2020, many sales teams fell into the aggressive investment approach of working to capture every last dollar of ARR and growth at all costs. As we all know, things have changed. Today, it is harder for founders to raise venture capital, add debt to the balance sheet or find acquirers. This means that the market is demanding that all companies improve the health of their company and increase efficiency. While this initially feels like a shock to operators, once you start to run your company on a new set of metrics, you'll find that you have time to focus on nailing culture, solving real problems for customers and enjoying the process of building something to last.
I'd love to hear your thoughts and other levers you are finding to build an even better version of your company. Until then, happy building!

The quarter has closed and it’s time to review our developer tools indices. Along with a check in, we’re using our indices to look at the overall movement in the market. What has happened to tech stocks in the last quarter and is it rational? That’s what we will dive into in this post.
When the market goes down by 10% or more, that’s technically called a “correction”. I usually laugh because it’s a sugar coated way to say “10% decline”, and it implies that the previous prices were wrong and the new ones are right, which of course no one knows for sure. Let’s spend a little more time and see if we think this decline in Q1 is a correction or something else. To do that, we will take a look at financial ratios used to value companies and see how they compare over time. We will use the companies in our Polychrome Developer Tools Public 25 index to illustrate.
In a previous post, I reviewed some internal financial metrics that help SaaS companies manage their operations. These valuation ratios are a bit different. These are external metrics that investors use to value software companies.
Today we will have some fun and try to decipher the market a bit, but it’s important to keep in mind that while valuations and stock prices move quickly with market trends, in general the underlying businesses continue to operate the same. Same people, same product, same customers - as operators we know the best thing to do is keep our head down and focus on the things we can control within our business. If that gets you excited you can stop reading now and get back to work, no hard feelings.
But let’s have our fun. I’ll take a look at a traditional financial metric, and one that has been used as a valuation rule for software over the last few years.
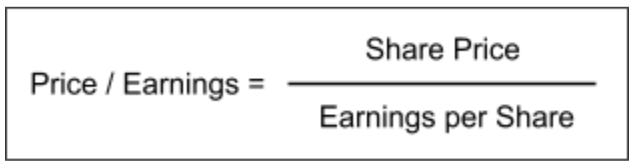
Price / Earnings Ratio: If you invest based on the present value of all future cash flows, you probably pay a lot of attention to P/E ratios. A higher P/E ratio means the market is putting a higher relative price on that company.
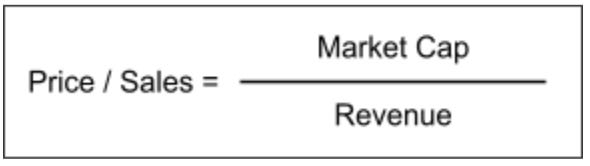
Price / Sales Ratio (aka Revenue Multiple): Want to see how a high growth software company is valued as compared to others? A common metric used is the revenue multiple: Price / Sales. This is more common because the value in high growth businesses isn’t knowable from the earnings today, it’s based on future expectations.
To set some context, let’s look at the most broad view of each ratio available. For this I will use the S&P 500, which is a good indicator of the general market.
This one dates all the way back to the 1800’s. Probably better to focus on the last 20 years or so.

Source: https://data.nasdaq.com/data/MULTPL/SP500_PE_RATIO_YEAR
This graph only shows the last 20 years, that’s all that was publicly available.
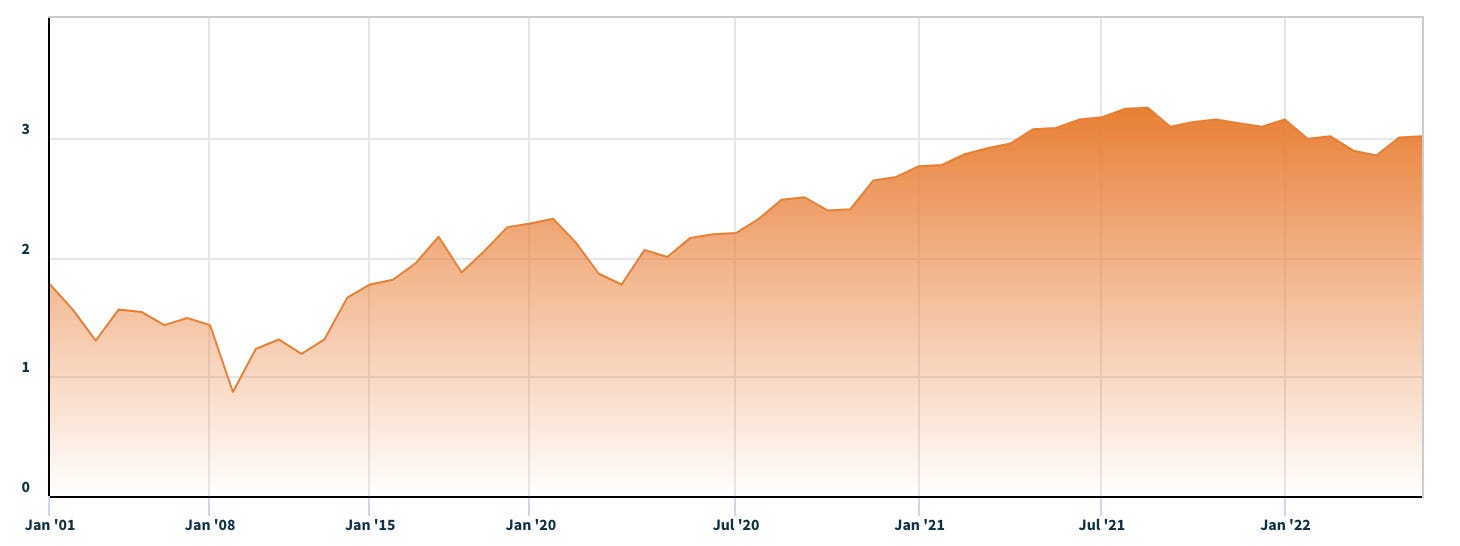
Source: https://data.nasdaq.com/data/MULTPL/SP500_PSR_YEAR
These charts show that both ratios have increased over time, and that they were at or near all time highs in 2021. Even after this decline they are on the high end relative to historical trends.
Now let’s check out how the specific companies in our index measure up. Our index is pretty young, so I chose to go back just 5 years1.
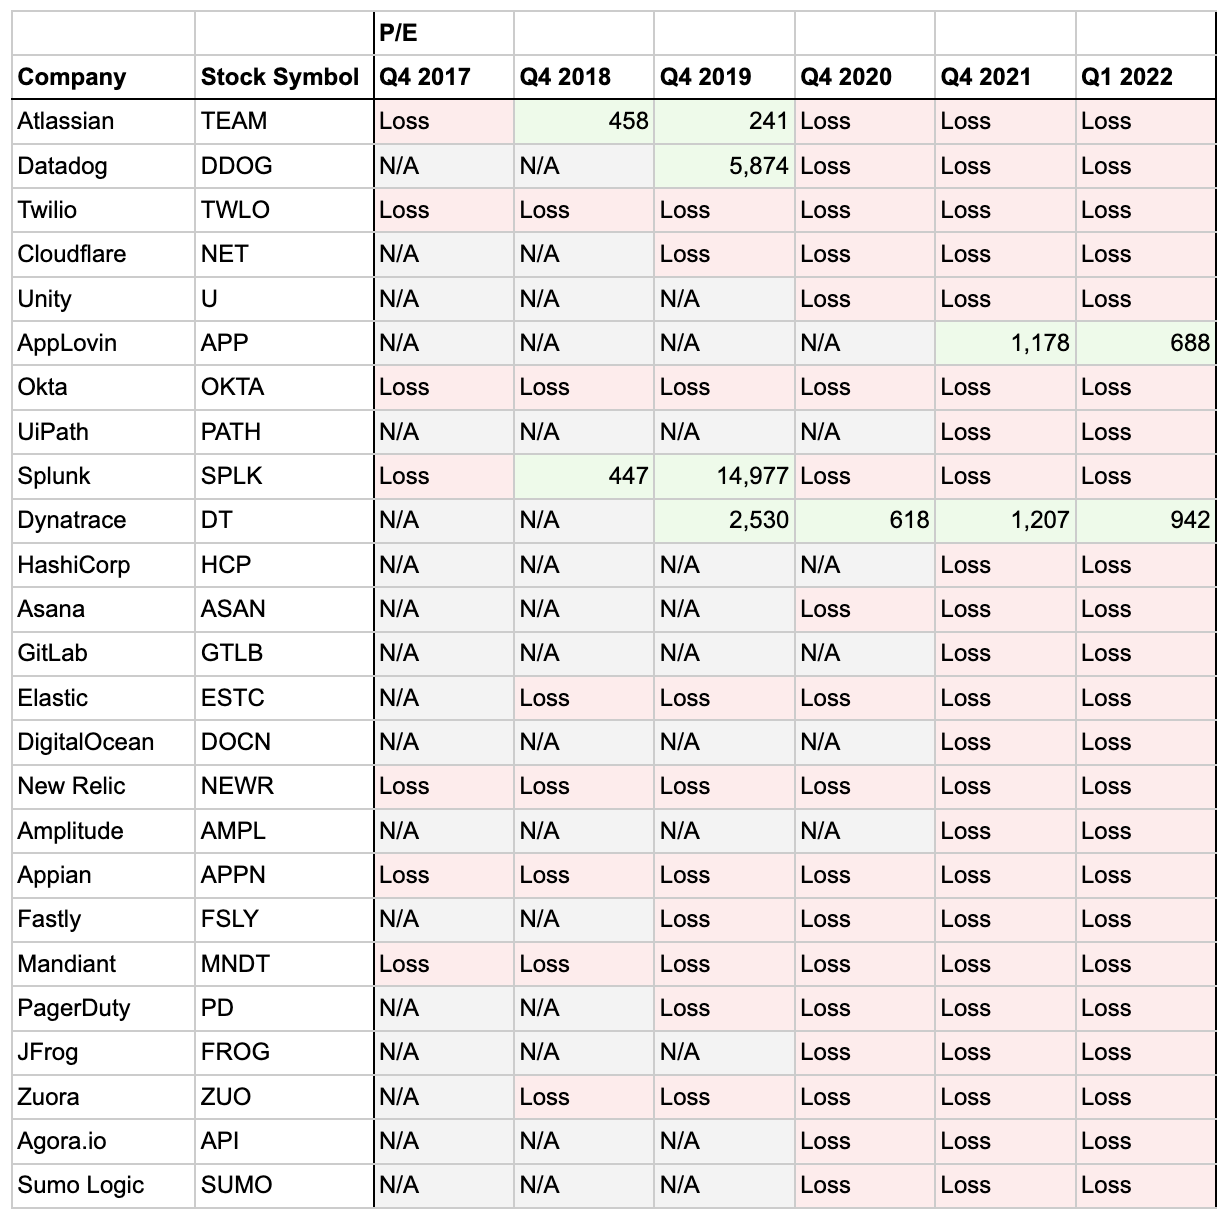
With that out of the way, here is the historical P/E Ratio for each of the companies in our index. The first thing you notice is that any of these companies delivering a profit is rare. And when they do, the P/E Ratio is wildly high compared to the broader market, which ended the year around 30 (see above). It’s clear that these stocks are not being valued on a simple P/E Ratio.
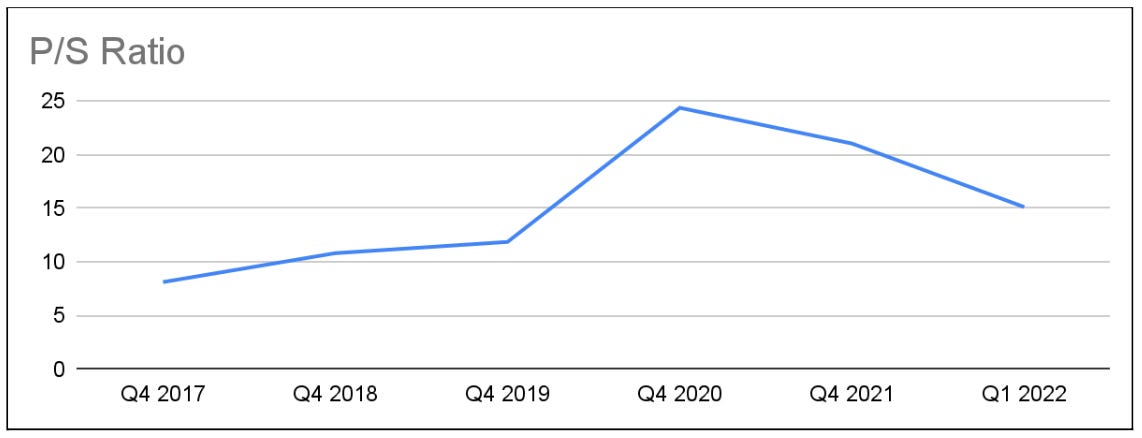
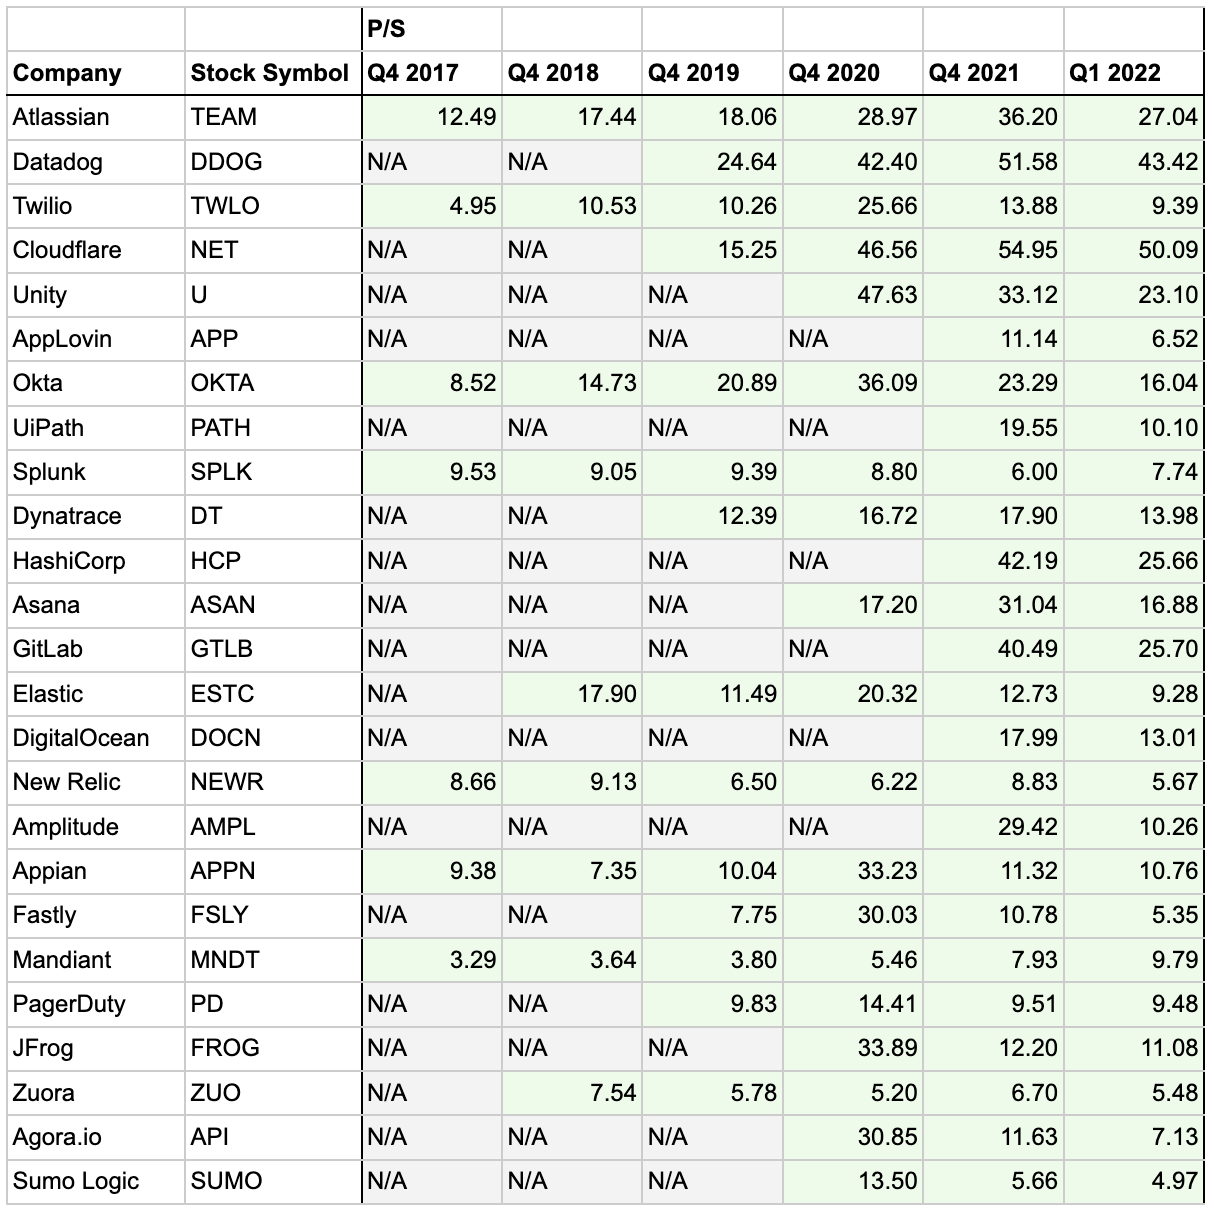
Let’s take a look at the Price / Sales Ratio for each of the companies in our index. This starts to show some trends, so I also included a chart that is a simple average of our index companies. You can see the ratio rose from about 8 back in 2017 to almost 25 in 2020, and back down to 15 as of Q1 2022. On the individual level, almost every single company followed this general trend. It’s also interesting to note that these are significantly higher than the general market, which ended the year around 3. Clearly the market is valuing the companies in this index higher than most public companies. This is based on future growth and profitability expectations, neither of which are easily captured or explained in ratios like these.
Now we have seen the ratios over time for the broader market, and for our index. So has this decline been a “correction”? Has it over or under corrected? I can’t answer that question for sure, but looking at the trends it gives me the feeling that in large the spike we saw in 2020 and 2021 were above normal prices and we are back into a more “normal” range. Time will tell, there are many factors, and some individual companies will live up to much greater valuations, while others fall far short.
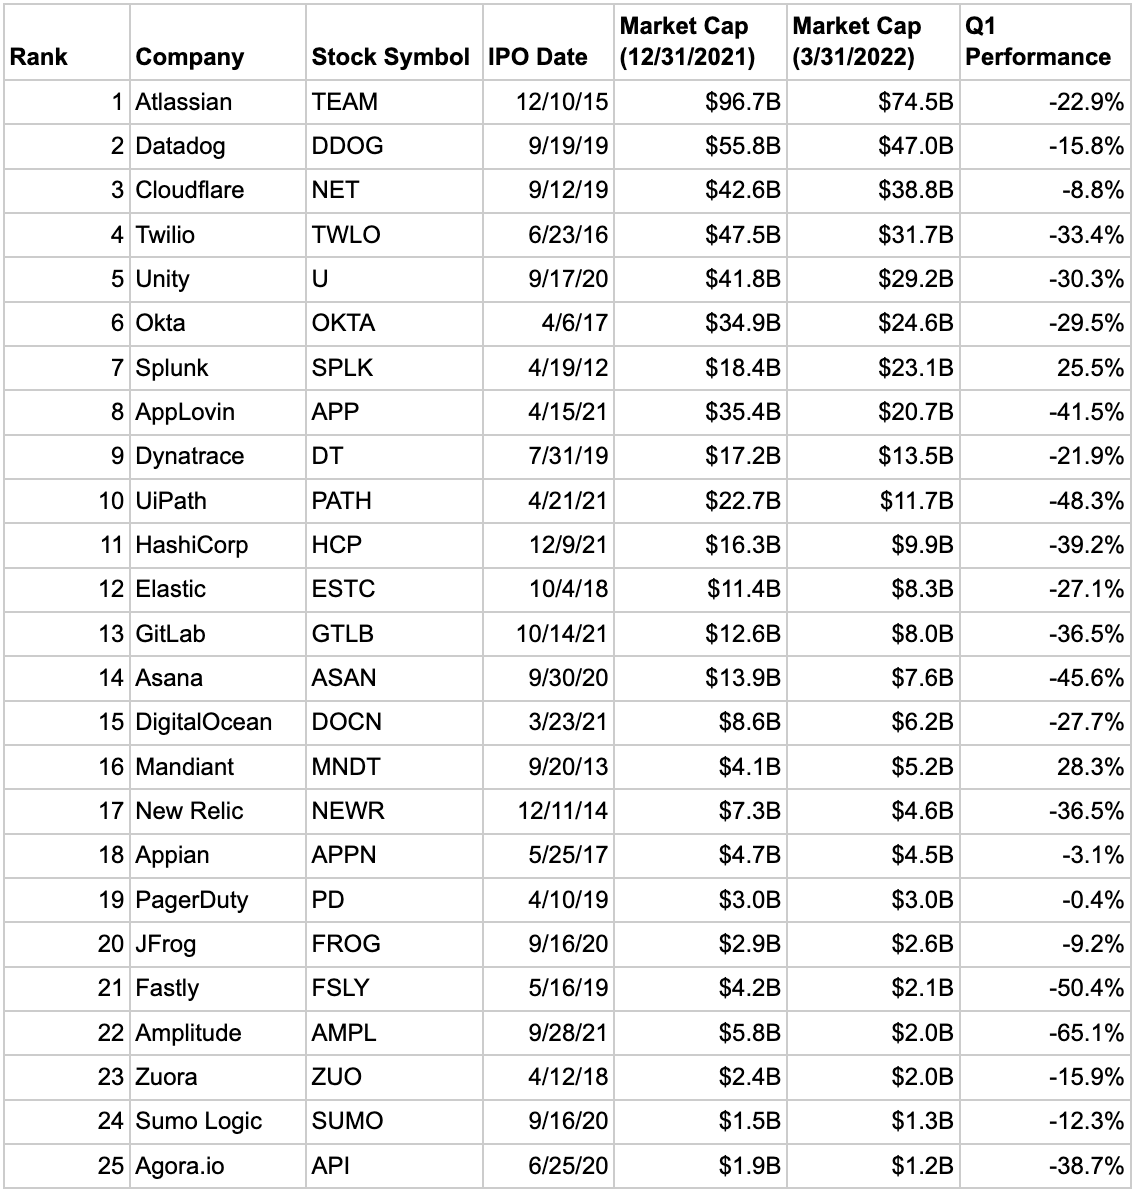
We recently shared the details of the companies in the Polychrome Developer Tools Public 25 for 2022. With a quarter down, let’s check in on them.
As we saw in the ratios above, Q1 was tough on the market, and even more so on the companies in this index. In fact, down 25.4% on the quarter, the performance was so poor that the index gave up all the gains from 2021 and then some. Here’s how the quarter ended and how that compares to other indices.
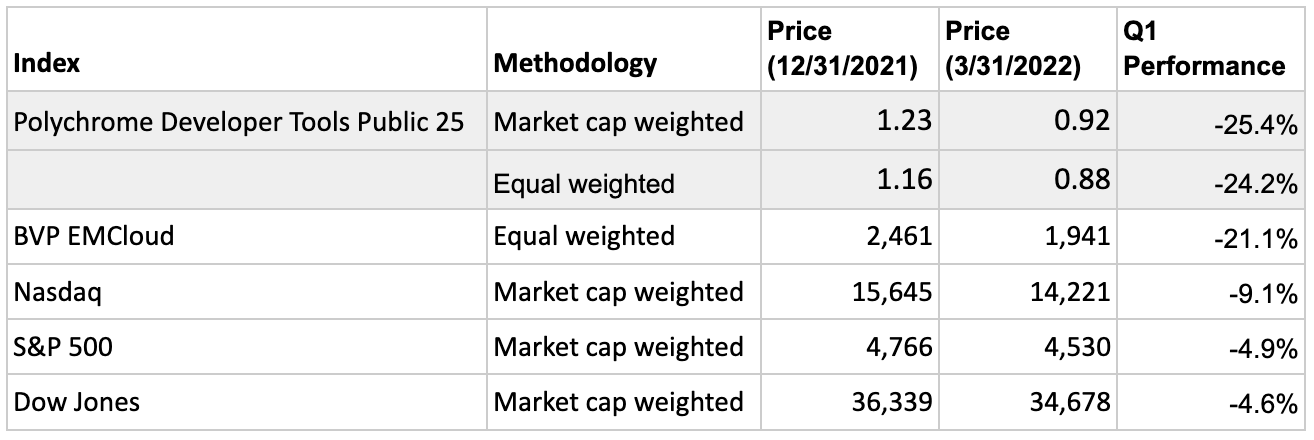
On an individual basis, the results were surprisingly uniform. Every single company was down in the quarter, except two, both of which are being acquired (Mandiant by Google, and Splunk by Cisco).
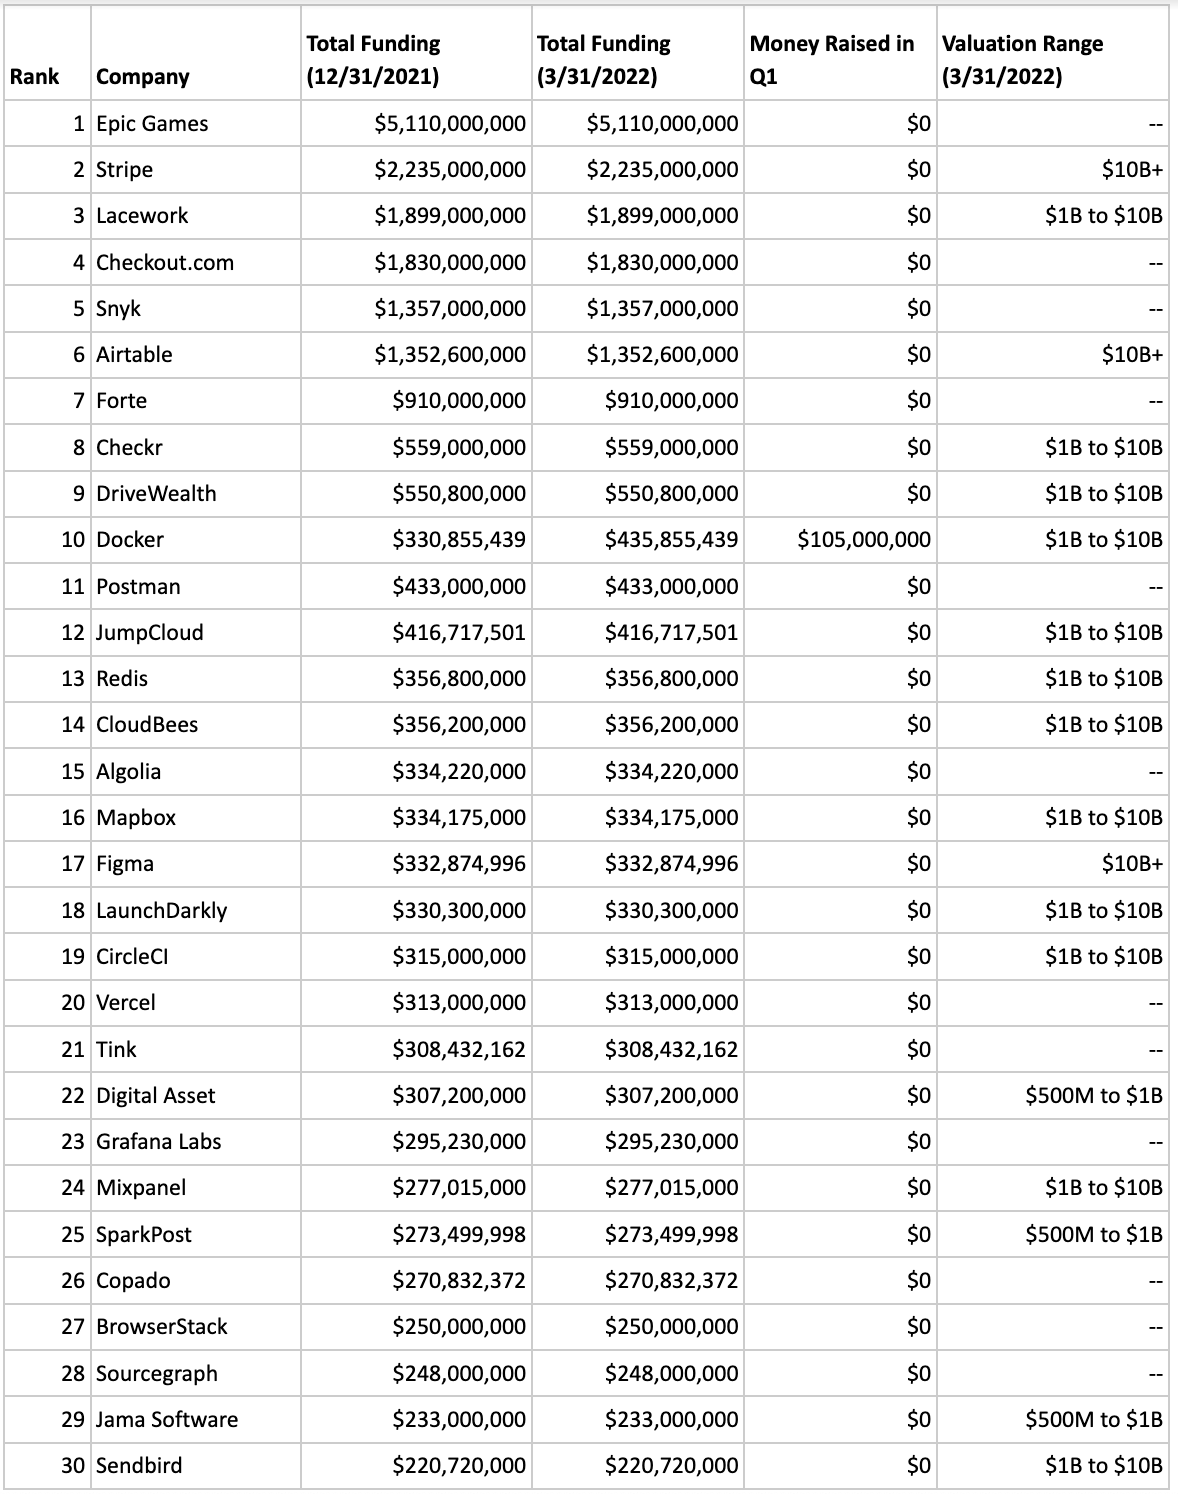
One big question that has been on my mind is how the changes in the public markets are impacting the private market. Are companies still raising rounds? Are there IPOs? Are valuations down? Let’s check out our Polychrome Developer Tools Private 30 index to see.
Are companies still raising rounds? One company raised $105M in Q1 2022, taking the total funding of the index from $22.3B to $22.7B. This is no question lower than our average quarter for 2021, which was around 5 raises and $1.5B. It’s fair to say that the pace of fundraising slowed in Q1.
Are there IPOs? There were no IPOs in Q1. Last year there were 5 IPOs in the year, so this is showing some weakness.
Are valuations down? Unfortunately due to the nature of private transactions I couldn’t obtain that information for certain. However, the size of the one round, raised by Docker, feels small. They had previously raised $330M, adding $105M is not an aggressive investment it feels more like a bridge round.
Overall the story is pretty consistent; private markets are less volatile, but they were weaker in Q1 along with the public market.
I hope this was interesting. Now let’s get back to focusing on the things we can control within our businesses!
Thanks,
Alex
A few notes on methodology: a) I am using GAAP/IFRS definitions for EPS. b) I am calculating Revenue based on Q4 * 4 instead of trailing twelve months, to easier align across calendar years. c) Since we do not yet have Q1 2022 Revenue, I am assuming Q4 2021 * 4. d) Some companies do not have 5 years of public financials, in that case I wrote “N/A”. Some companies had an earnings loss in some or all periods, in that case I wrote “Loss” for the P/E Ratio. e) Some companies end their fiscal quarter on Dec 31, others on Jan 31. I used the fiscal year end for Revenue and EPS. I used the calendar year end for Market Cap and Price. f) Mandiant (MNDT) sold its FireEye division in Q4 2021, I used EPS from continuing operations only.

We launched the Polychrome Developer Tools Indices at the beginning of 2021 on the thesis that within B2B SaaS there was a particularly interesting area in developer tools. The developer tool space, long dominated by a few juggernauts (Microsoft, IBM) was starting to explode and some big valuable businesses were emerging (Atlassian, Datadog, PagerDuty). Out of interest, we began tracking an index of the largest public and an index of the largest private developer tools companies.
With the first year in the books today we will check-in on how the indices performed, and also make updates to the included companies for 2022.
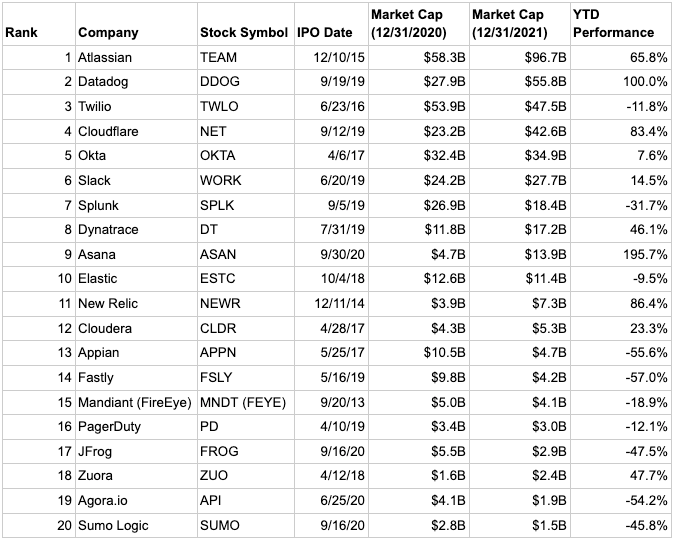
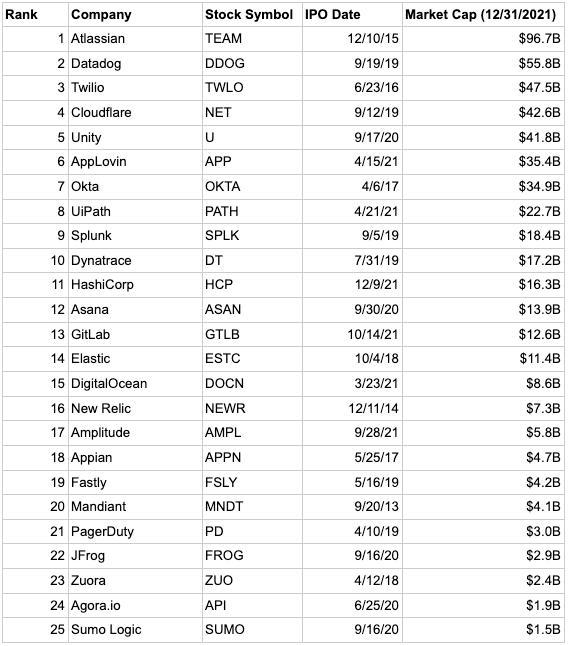
First, let’s see how our Public 20 index performed in 2021. As a reminder this list is the most valuable 20 developer tools companies, by market cap, which initially listed their stock publicly within the last 10 years (as of Jan 1, 2021). Let’s see how Q4 and the full year fared for the index and compare the performance vs. other indices.
The Polychrome Developer Tools Public 20 declined in Q4 by 3.0%, but was able to end the year up 23.4%. Great returns in year 1, but a decline in Q4 and clouds on the horizon for tech and the markets in general. I’ll say it again, we are in it for the long run.
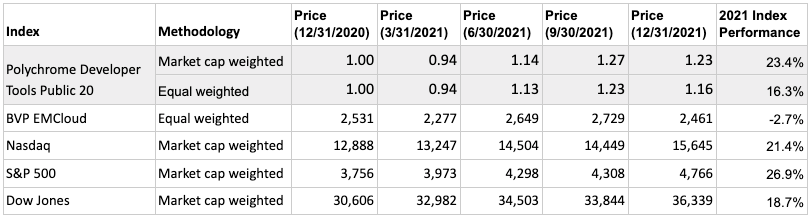
In 2021 we saw an interestingly large divergence in performance across the portfolio. Some companies were up over 100% and others down over 50%. The index ended up 23.5% on a market cap weighted methodology. However it was only up 16.3% on an equal weighted methodology. This shows that the larger companies in the index performed better than the smaller ones. In fact, starting the year, 10 of our companies had a market cap greater than $10B and 10 had a market cap less than $10B. Of those above $10B, 6 increased in value in 2021. Of those below $10B, only 4 increased in value in 2021.
Another interesting thing that happened is that 3 of the 20 companies were acquired. That’s 15%! This shows that developer tools companies are being seen as strategic areas for larger technology companies to invest in. We will see what happens with this in 2022, when prices might look even more tempting.
Notes:
Slack was acquired by Salesforce on July 21, 2021. For Q3 and Q4 2021 we will use the acquisition price of $27.7B as the market cap for WORK.
Cloudera was acquired by KKR on Oct 8, 2021. For Q4 2021 we will use the acquisition price of $5.30B as the market cap for CLDR.
FireEye sold its FireEye segment and rebranded as Mandiant MNDT on Oct 8, 2021.
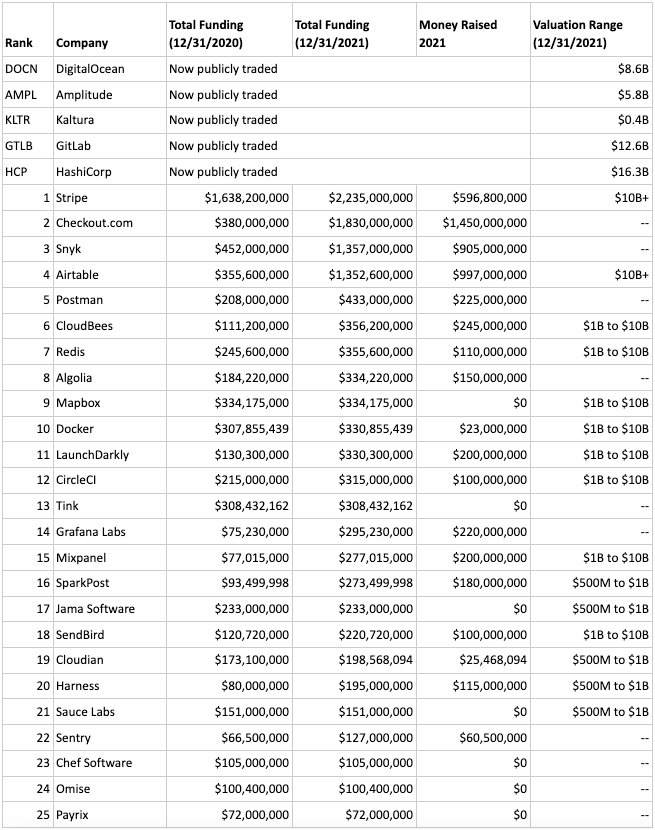
Now let’s check in and see how our Private 30 index performed in 2021. Again, this list is the 30 most funded developer tools companies, by dollars raised, which remain private (as of Jan 1, 2021). This updates total funding, valuation range, and shares a few items to note. In terms of funding, valuation ranges, and IPOs, this index had a great year!
Let’s start with the IPOs; 5 of the 30 companies went public in 2021. That’s 17%! Those companies entered 2021 having raised $1.2B and now have a market cap of $43.7B. Congrats to DigitalOcean, Amplitude, Kaltura, GitLab, and HashiCorp.
Let’s check out total funding. These numbers exclude the five companies above that went public. Our remaining 25 companies started the year having collectively raised $6.2B. In 2021 18 of the 25 raised additional capital (72%). In total they raised $5.9B, bringing the total funding for the group to $12.1B!
It’s interesting to look at the trend by quarter as well. Q4 had the least rounds closed (3), but they were some big ones (total $2B)! Congrats to the companies that raised in Q4; Checkout.com who raised $1B, Airtable who raised $735M, and Cloudbees who raised $245M.
Without further ado, here is the 2021 performance for the Polychrome Developer Tools Private 30.
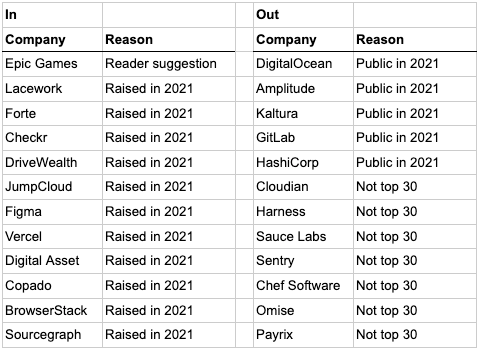
As we said when we launched the Developer Tools Indices, we would rebalance annually. This is to make sure we always are tracking the largest public and private developer tools companies. It’s also helpful since there were a lot of graduates from last year's indices. We also said that we hoped the Public 20 could become the Public 30 someday, and this year we are bumping it up to the Public 25. So here are the companies that will make up each index for 2022!
This list is the most valuable 25 developer tools companies, by market cap, which have initially listed their stock publicly within the last 10 years.
Here’s what changed in the index from 2021:

Here is the Polychrome Developer Tools Public 25:
We are a bit into 2022 and by and large Q1 has been bad for this index. We will have our regular quarterly update and thoughts when Q1 closes in just a few weeks.
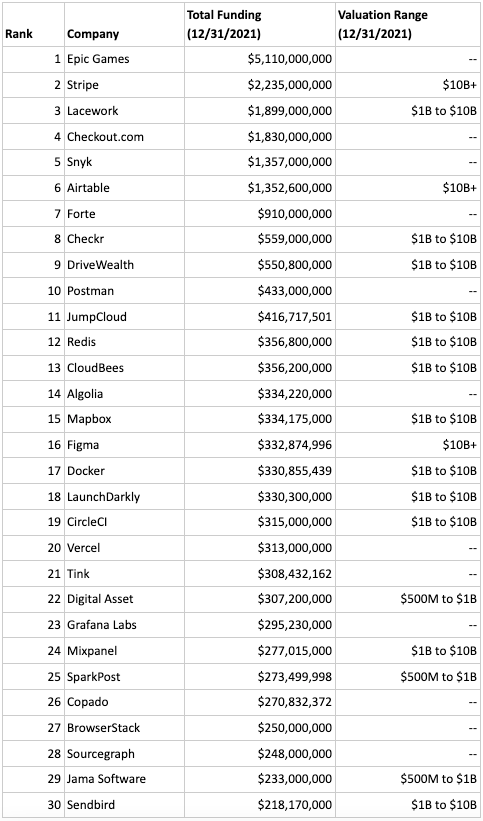
This list is the 30 most funded developer tools companies, by dollars raised, which remain private. There are a lot of changes to this index, which gives a little insight on how 2021 was for private developer tools companies.
A lot of venture capital was deployed in 2021. The least funded company to make the list for 2021 was $66M, to make the 2022 list a company needs to have raised >$200M! The companies on our list for 2022 raised a total of over $20B, and all but two raised money in 2021.
Open Source companies are holding five spots in the index with names like Redis, Docker, and Sourcegraph. Open source developer tools is a space we know well, our portfolio companies Flagsmith and Browserless are both open source developer tools. This is a trend we are keeping a close eye on.
Several Blockchain / Fintech companies jumped onto this list. 2021 saw a huge amount of buzz in that market, and it showed by landing big funding rounds for companies like Checkout.com, Lacework, Forte, and more.
Here’s what changed in the index from 2021:
Here is the Polychrome Developer Tools Private 30:
With 2021 being the year of the IPO, what will happen in 2022? There are some big names in this group still waiting to break out; Stripe, Snyk, Airtable - we will have to wait and see.
Check in again soon to see Q1 results and our analysis of what is going on for these companies in the current market selloff.
Thanks,
Alex
Loading more posts…
